Calculate
SOC change
Monitoring:
A project that off-sets CO2 by
carbon sequestration should be able to prove that significant carbon gains have
occurred following a given land management practice compared to the
pre-treatment baseline (Olson, 2013).
Calculating
change in SOC stocks
Change in SOC= SOCt+1 – SOCt
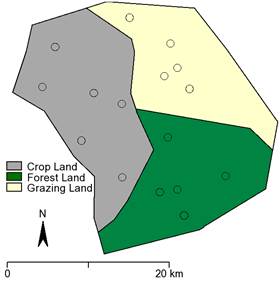
Suppose that a 664.5 ha watershed consists of Crop land (252 ha), forest
land (197.9 ha), and Grazing land (214 ha) (Figure 1).
Based
on the baseline and SOC measurement after 5 years (Table 1) the mean SOC stock
in the study area has increased by 1.44 ± 0.79 over 5 years with
95% confidence level. The CO2 equivalent is calculated by
multiplying SOC stock by 44/12.
Table 1.
Example data on changes in SOC stocks between time measurements (click HERE for a spreadsheet
example)
|
Land
use |
Plot |
|
SOC stocks (t ha-1) |
|
|
|
|
T0 (baseline) |
T1 (after 5 years) |
Change (T1- T0) |
|
Crop land (252 ha) |
1 |
35 |
36 |
1 |
|
2 |
22 |
24 |
2 |
|
|
3 |
33 |
32 |
-1 |
|
|
4 |
25 |
26 |
1 |
|
|
5 |
19 |
22 |
3 |
|
|
6 |
27 |
30 |
3 |
|
|
Forest land (197.9 ha) |
1 |
35 |
38 |
3 |
|
2 |
22 |
21 |
-1 |
|
|
3 |
33 |
33 |
0 |
|
|
4 |
25 |
27 |
2 |
|
|
5 |
19 |
19 |
0 |
|
|
Grazing land (214 ha) |
1 |
35 |
37 |
2 |
|
2 |
22 |
26 |
4 |
|
|
3 |
33 |
34 |
1 |
|
|
4 |
25 |
26 |
1 |
|
|
5 |
19 |
21 |
2 |
|
|
|
|
|
|
|
|
Summary |
|
|
|
|
|
Mean SOC |
t ha-1 |
26.81 |
28.25 |
1.44 |
|
Standard deviation SOC |
t ha-1 |
6.21 |
6.16 |
1.46 |
|
Standard error of mean |
t ha-1 |
1.55 |
1.54 |
0.37 |
|
t value (α =
0.05, n-1) |
|
2.13 |
2.13 |
2.13 |
|
95% confidence level of the mean |
|
3.30 |
3.28 |
0.79 |
|
95% CI of mean, lower |
t ha-1 |
23.51 |
24.97 |
0.65 |
|
95% CI of mean, upper |
t ha-1 |
30.11 |
31.53 |
2.23 |
|
|
|
|
|
|
|
Total SOC stocks |
t |
17815.28 |
18772.16 |
956.88 |
|
95%
confidence level of total SOC |
|
2193.85 |
2179.56 |
524.96 |
|
95% CI of total, lower |
15621.43 |
16592.60 |
431.92 |
|
|
95% CI of total, upper |
20009.13 |
20951.72 |
1481.84 |
|
|
|
|
|
|
|
|
CO2 equivalent total |
|
65322.69 |
68831.25 |
3508.56 |
|
95%
confidence level of total CO2 equivalent |
|
8044.12 |
7991.72 |
1924.85 |
|
CO2
equivalent CI total, lower |
t |
57278.57 |
60839.53 |
1583.71 |
|
CO2 equivalent
CI total, upper |
t |
73366.81 |
76822.97 |
5433.41 |
|
Report |
|
|
|
|
|
Mean SOC ± 95% confidence level |
t ha-1 |
26.81 ± 3.3015 |
28.25 ± 3.28 |
1.44 ± 0.79 |
|
Total SOC ± 95% confidence level |
t |
17815.28 ± 2193.85 |
18772.16 ± 2179.56 |
956.88 ± 524.96 |
|
Total CO2 equivalent |
CO2 e |
65322.69 ± 8044.12 |
68831.25 ± 7991.72 |
3508.56 ± 1924.85 |
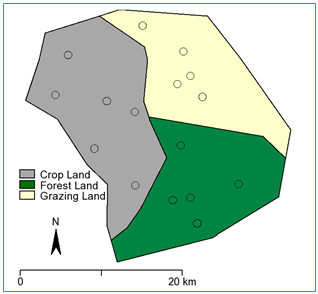
Both the mean and total carbon stocks
could change with change in land use. In Figure 2, for instance, part of the forest
land is converted into cultivated and grazing lands.
Refer Donovan (2013) for more information on calculating SOC change.
___________
Donovan, P. 2013. Measuring soil carbon change: A flexible, practical, local method.